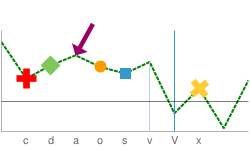
If you have ever used Google Charts before you have probably used the shape markers…
…I wanted shape markers in flot to diplay alerts on certain data points in my graphs, something I couldn’t find support for. After the jump you can check out my solution.
What I Want
The most basic usage of flot might look something like this…
So my goal here is to add the same type of functionality as Google Charts Shape Markers by allowing you to specify the indicies that you would like to add a custom shape marker, in my case, I wanted to mark the indicies where errors had occurred.
Modifying jquery.flot.js
The first thing I did was just to add errorIndicies as a property to the “points” object.
 points: {
 show: false,
 errorIndexes: [],
 radius: 3,
 lineWidth: 2, // in pixels
 fill: true,
 fillColor: "#ffffff"
 },
Around Line 55
Next, I modified the plotPoints() function to check to see if the point we are rendering is at an index in our errorIndicies array for this series of data points.
 function plotPoints(data, radius, fill, axisx, axisy) {
 for (var i = 0; i < data.length; ++i) {
 if (data[i] == null)
 continue;
var x = data[i][0], y = data[i][1];
 if (x < axisx.min || x > axisx.max || y < axisy.min || y > axisy.max)
 continue;
 if(jQuery.inArray(i, series.points.errorIndexes) >= 0) {
 // Draw our custom shape here!!
 } else {
 ctx.beginPath();
 ctx.arc(axisx.p2c(x), axisy.p2c(y), radius, 0, 2 * Math.PI, true);
 if (fill)
 ctx.fill();
 ctx.stroke();
 }
 }
 }
Around Line 1283
From here on, you have axisx.p2c(x), axisy.p2c(y), and radius that give you information about the point you are drawing and you can just use standard Javascript canvas functions to output your custom shape.
Me? I wanted to output little red X’s with a white border…
 // Draw Red X
 var old_style = ctx.strokeStyle;
 var old_line_width = ctx.lineWidth;
ctx.strokeStyle = “white”;
ctx.lineWidth = 3.5;
ctx.beginPath();
ctx.moveTo(axisx.p2c(x)-4, axisy.p2c(y)-4);
ctx.lineTo(axisx.p2c(x)+4, axisy.p2c(y)+4);
ctx.moveTo(axisx.p2c(x)+4, axisy.p2c(y)-4);
ctx.lineTo(axisx.p2c(x)-4, axisy.p2c(y)+4);
ctx.closePath();
ctx.stroke();
ctx.strokeStyle = “red”;
ctx.lineWidth = 2;
ctx.beginPath();
ctx.moveTo(axisx.p2c(x)-3, axisy.p2c(y)-3);
ctx.lineTo(axisx.p2c(x)+3, axisy.p2c(y)+3);
ctx.moveTo(axisx.p2c(x)+3, axisy.p2c(y)-3);
ctx.lineTo(axisx.p2c(x)-3, axisy.p2c(y)+3);
ctx.closePath();
ctx.stroke();
ctx.strokeStyle = old_style;
 ctx.lineWidth = old_line_width;

Also, canvas allows you to output images so if you don’t want to draw your shape, you can just output an image instead.